 |
 |

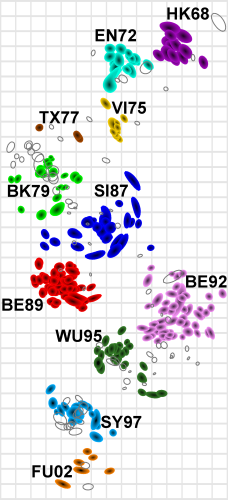
Antigenic map showing the evolution of the Influenza A (H3N2) virus
evolution from 1968 to 2002. |
 |
Antigenic Cartography is the process of creating maps of antigenically variable pathogens (more details). In some cases, as in the image on the left, two-dimensional maps can be produced which reveal interesting information about the antigenic evolution of a pathogen. Antigenic maps differ from genetic analyses in that they are based on data that reflect the antigenic properties of a pathogen (in this case as revealed by haemagglutination inhibition assay data). There is a close relationship between genetic and antigenic change for human influenza A(H3N2) virus, but genetic distance can be an unreliable predictor of antigenic distance. For example, a change in a single amino acid may cause a disproportionately large change in the binding properties of a virus strain. Antigenic maps can reveal large movements in the antigenic space that may be due to minimal amino acid changes. Antigenic cartography therefore offers the possibility of improved understanding of genetic and antigenic evolution. Click here for published antigenic data. *Smith, D. J., Lapedes, A. S., de Jong, J. C., Bestebroer, T. M., Rimmelzwaan, G. F., Osterhaus, A. D. M. E., & Fouchier, R. A. M. (2004). Mapping the antigenic and genetic evolution of influenza virus. Science, 305(5682), 371–376. http://doi.org/10.1126/science.1097211 **Fonville, J. M., Wilks, S. H., James, S. L., Fox, A., Ventresca, M., Aban, M., et al. (2014). Antibody landscapes after influenza virus infection or vaccination. Science, 346(6212), 996–1000.http://doi.org/10.1126/science.1256427 Last modified: 29 September 2021
|
 |
SoftwareRacmacs is an R package that provides a toolkit for making antigenic maps from assay data such as HI assays. Click to get information about the source code of Acmacs - a library for making antigenic maps ContactThe Antigenic Cartography Group at the University of Cambridge |